Visualizing Fisheries Data with Sankey Diagrams
Sankey diagrams are an excellent tool for visualizing the flow of quantities between categories. In the context of fisheries data, they help illustrate how different fishing methods contribute to the harvest of various species. This guide will show you how to use a Python script to generate code for Sankey diagrams in different formats.
Overview
The Python script (available on my github) can read a CSV file and generate code snippets for Sankey diagrams in the following formats:
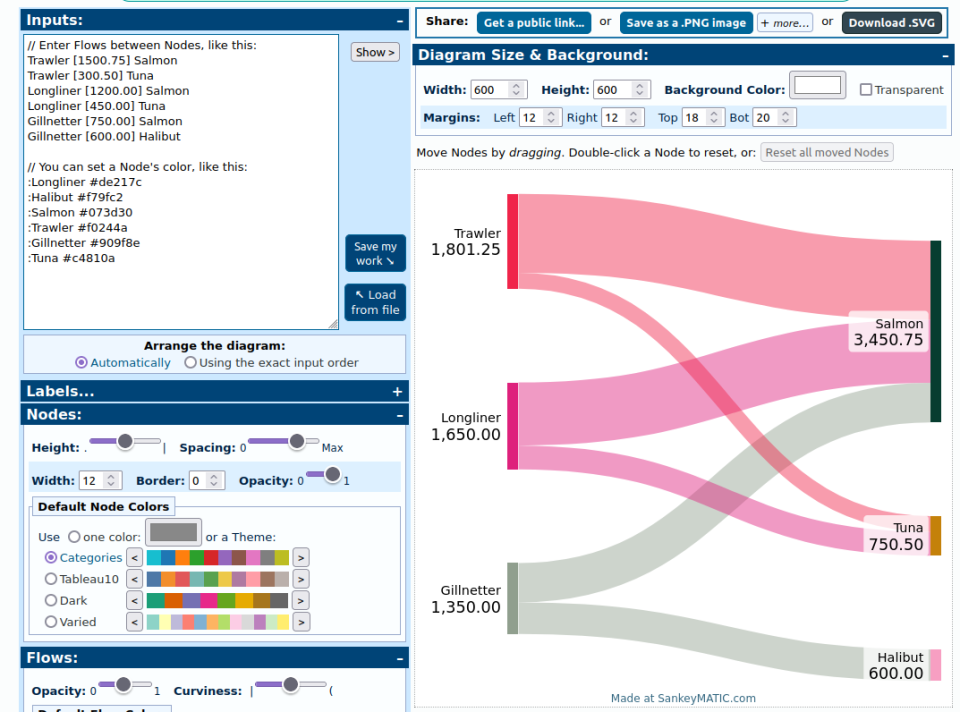
- SankeyMATIC: A web-based tool for creating Sankey diagrams.
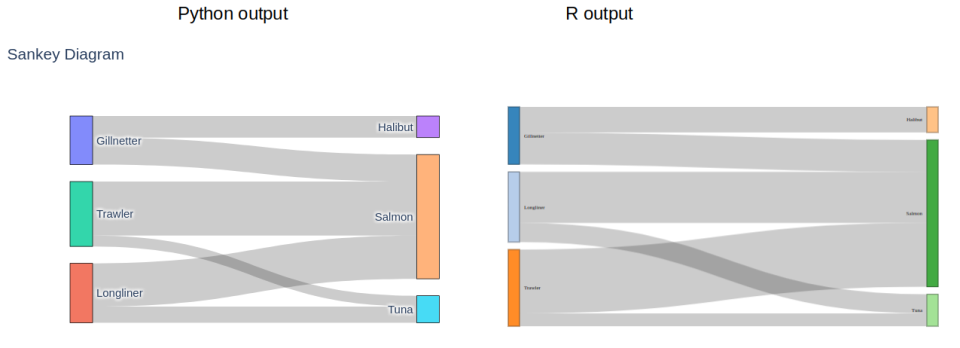
- Python (using Plotly): An interactive plotting library for Python.
- R (using networkD3): An R package for interactive network diagrams.
How It Works
1. Prepare Your CSV File
Your CSV file should include these columns:
- Source: The origin of the flow (e.g., fishing method).
- Target: The destination of the flow (e.g., species caught).
- Value: The quantity of the flow (e.g., weight of fish).
Example CSV File:
Engine,Species,Weight
Trawler,Cod,500
Longline,Cod,200
Trawler,Haddock,300
Longline,Haddock,100
...
2. Using the Python Script
The Python script processes your CSV file and generates code snippets for various Sankey diagram formats. You can specify the desired output format using the --output option:
- sankeymatic: Generates code compatible with the SankeyMATIC web tool.
- python: Produces code for creating interactive Sankey diagrams in Python using Plotly.
- r (networkD3): Creates code for generating Sankey diagrams in R using the networkD3 package.
- all: Outputs code snippets for all the above formats.
Example:
python sankey_formatter_all.py.py data.csv --output sankeymatic
Python and R output are pretty basic and may be enhanced by playing with the different options.
By copy/pasting the output in SankeyMATIC, it's easier to modify the output Sankey diagram as you need.